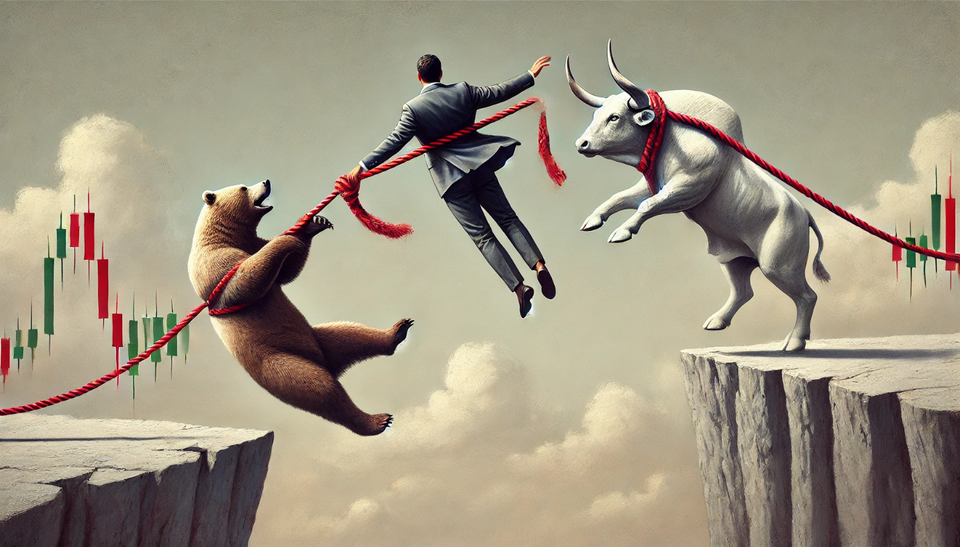
The rally that started on Jul/14 is surprisingly still alive. The main indexes have had some decent gains without any serious pullback. Only the Nasdaq and the Russell 2000 remain in Bear Market territory (a loss of 20% or more from the previous high). It's time to see if the Bulls are serious about taking control of the Market since the 4,200 level of the S&P 500 looks like it won't be easy to break.

Market Overview
Since the rally that started on Jul/14 the Market seems to be modifying its behavior. On the daily S&P 500 chart, the index in the past tended to decline once it reached the 30-day EMA (blue line in the screenshot below) and there had been only two rallies since Oct/2021 that had lasted more than four days.
Now the S&P 500 has been rallying for sixteen trading days without any serious pullback. However, the major gains were during the first eleven days of the rally. During the last five bars the rally stalled. The horizontal dotted black line around 4,200 shows an area of high volume that will likely act as a resistance.
Additionally, the other two times that the index was overbought on the daily chart (orange circled areas where overbought is defined as the +3 Keltner Channel), the index had sharp pullbacks that sent it to the -3 Keltner Channel (KC).

In order to gain a wider perspective of the current situation it's useful to review the weekly chart of the S&P 500. The downtrend that started back on Jan/2022 (lower highs and lower lows highlighted by the horizontal black lines) was very clear before the rally but now its structure is being damaged. The rally is attempting to get past the high reached on Jun/02 of 4,177. If the Bulls manage to close decisively above 4,200 the downtrend will be seriously compromised and the hope of a new Bull Market or at least the Market tracing a bottom becomes a very real possibility.

If we take the lowest point of 3,636.87 that was reached on Jun/17 and the highest level of 4,167.66 from Aug/03 the S&P 500 already has advanced 14.6%. Not that far from what we could consider a criteria for a Bull Market (an increase of 20% or more from the previous low).

If we take a look at the New Highs and New Low numbers (NH-NL), the Monthly and Quarterly timeframes have been able to maintain the New Highs at bullish levels and the New Lows haven't been able to increase significantly. The Monthly timeframe (columns G, H and I) is the fastest timeframe of this leading indicator, it's the one I check more often in order to get an idea of the potential Market direction.

Industries
It takes time for the different Industries to start switching direction as the Market behaves differently. This weekend I was able to find only one Industry that I would consider strong. That's still a low number considering the 68 Industries that compose the Global Classification Standard (GICS).
There are several Industries that started to recover, I consider that it's still early to identify which of those Industries that are rallying will be the leaders of the next Bull Market.

Scenarios
Scenario #1: The most likely scenario, from my point of view, is that the Market will pullback. If the pullback happens and the S&P 500 stays at or above 3,940 it would be still a healthy pullback with a chance to recover and continue rallying. Below that level my analysis tells me that the selling pressure could be too strong and most likely the rally would end. There's no evidence of huge selling pressure so far, but we need to be ready for any kind of event.
Scenario #2: The second most likely scenario is that the S&P 500 could initiate a sideways movement that could give a much better idea if the Market is going to start tracing a bottom. I'm not optimistic in the most likely scenarios since the main negative catalysts affecting the Market haven't been solved. Anything can happen in the Markets, however we can't ignore that eventually the inflation/recession, the Ukraine war, the China tensions and the supply chain crisis will regain importance until they are solved.
Scenario #3: Bulls have been dominating at least for a few days the Market, the rally could continue, for me this is the least likely scenario but no one knows for sure what will happen. I have a few pilot trades, most of them with minor profits and losses, just one with a significant gain. I don't see the risk appetite already overcoming the Market fear. In this third scenario the rally would continue, maybe even enough in order to start changing the Market sentiment, one where greed and risk start influencing the traders' actions.
Summary
I love the idea of a new and powerful Bull Market, one that can last for months. I'm still careful and practicing strict risk management, I cannot assume that what happened in the last few days will continue to happen in the future. I'm enjoying the rally but for my particular way of trading I need further confirmation that the Market direction has changed.
A decline during the next trading week would give some good clues about the balance of power between Bulls and Bears. I'm still struggling to find great setups and my pilot trades are having mixed results. At least for me, I'm still unwilling to trade aggressively and reviewing/updating my stops is now, for me, an essential daily task.


