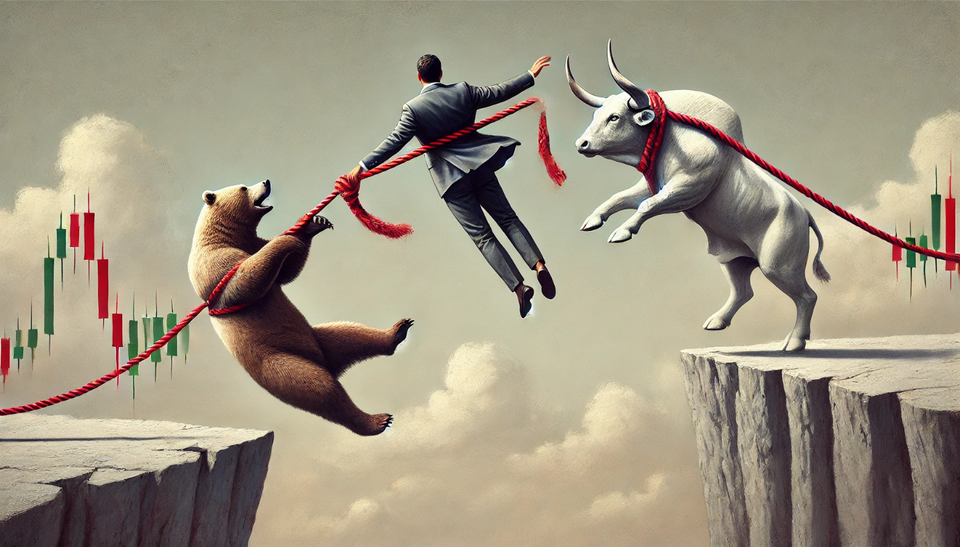
In the next few days anything can happen, no one can really be certain if the Markets will go up, down or just continue moving sideways. However, not all the scenarios are equally likely to realize, in the world of trading we need to deal with probabilities, lack of information and uncertainty. What are the clues that the Market has provided so far?
Market Overview
If we take a look to the daily S&P 500 chart, the Bulls haven't been able to overcome the pattern that keeps repeating during 2022. In several recent articles I have discussed that 4,200 is a zone that has a lot of activity, it will be a resistance difficult to break (orange circled areas). Additionally the 30-day EMA (blue line) has been serving as a resistance during the Correction/Bear Market. Five times during 2022 when the price level was close or just above the 30-day EMA there was a pullback (pink dotted arrows).
The current rally that started on May/25 could still resume, however the rally lasted three days and after that, it has just stalled. The longer the Bulls are unable to resume the rally, the more chances that the Bears will have to increase the selling pressure. We have had months where the number of bad news are more common and effective moving the Market than the amount of good news. I have repeatedly mentioned in the past that since Oct/2021, only two rallies have been able to last more than 5 days and up to last week that continues to be true (black dotted arrows).

The weekly chart of the S&P 500 takes longer to move and it's still not moving into a bullish direction. We started 2022 getting to a historical new high of 4,818 and now we are at 4,108 which is 710 points lower. The most concerning part is the pattern of lower highs and lower lows that keeps tracing the weekly chart (horizontal solid black lines). In order to break that pattern the S&P needs to rally and hold above 4,650 (green dotted arrow). The Bulls still seem to be too weak on the weekly chart, the 4,818 historical high reached the +2 Keltner Channel (KC), the next high was at 4,637 which only reached the +1 KC.
An isolated signal doesn't mean much by itself. However, when multiple signals keep confirming each other it's something to pay attention to. A three-day rally might look like something that gives hopes to the Bulls. We must not forget that previous to the rally, the Bears were able to dominate the Market during seven straight weeks where the Market lost 827 points. We haven't seen that kind of power from the Bulls for a while.

The New Highs and New Lows numbers (NH-NL) aren't very encouraging, they were bullish for a couple of days but now they are back to neutral. In any timeframe the Bears have been able to keep the NH-NL indicator at elevated New Lows for weeks, while the Bulls at best can turn it bullish for a a week at best.

Industries
The amount of Industries where I see strength is mostly unchanged from last week. Only a couple of Industries out of 68 that compose the Global Classification Standard (GICS) remain strong. I monitor every week all 68 Industries, eventually a few of them will start to move upward despite whatever is happening in the Market and those could become the new leaders of the next Bull Market.

Scenarios
Scenario #1: From my point of view, the most likely scenario is that the Correction/Bear Market will resume. The Bulls had their chance and they didn't make much out of it. The rally stalled, the NH-NL indicator went back to neutral levels, the amount of bad news still outweighs the positive news that move the Market from time to time. The Bulls had the chance to break the 4,200 resistance, which after every failed attempt just becomes stronger.
Scenario #2: The second most likely scenario for the next trading week, is that the indexes will continue moving sideways. If the current balance of power between Bulls and Bears stays without a significant change during the week, we could continue to see the controlled ups and downs around 4,200 without the index really going anywhere.
Scenario #3: The most unlikely scenario from my perspective is that the Bulls manage to break the 4,200 resistance and go to a level between 4,300-4,600. That kind of movement would require several days of positive catalysts that move the indexes up. We have had only a couple of rallies that lasted more than five days since Oct/2021. If this scenario happens, the catalyst needs to last for at least a week or more and be discounted by the Market as a big positive surprise. Something like a truce or the end of the Ukraine war might be able to generate this kind of positive Market movement.
Summary
Waiting every week for something to happen isn't something that comes natural to most of us. However, if the current Market conditions aren't conducive to a particular way of trading, then the sidelines are the safest place to preserve capital. A trader doesn't necessarily profits more if he/she trades more. A single well-planned trade can outperform a hundred losing trades. Every person chooses his/her battles, for me staying on the sidelines until there are better chart setups and the Market direction is clearer is giving me more peace of mind than trying to trade the current short lived rallies.


