
It's easy to get used to a powerful rally as long as we keep in mind that eventually there will be a pullback. The S&P 500 had moderate losses today, as the Russia-Ukraine talks don't look that promising anymore. Unfortunately, the mid-cap and small-cap indexes suffered a lot more.
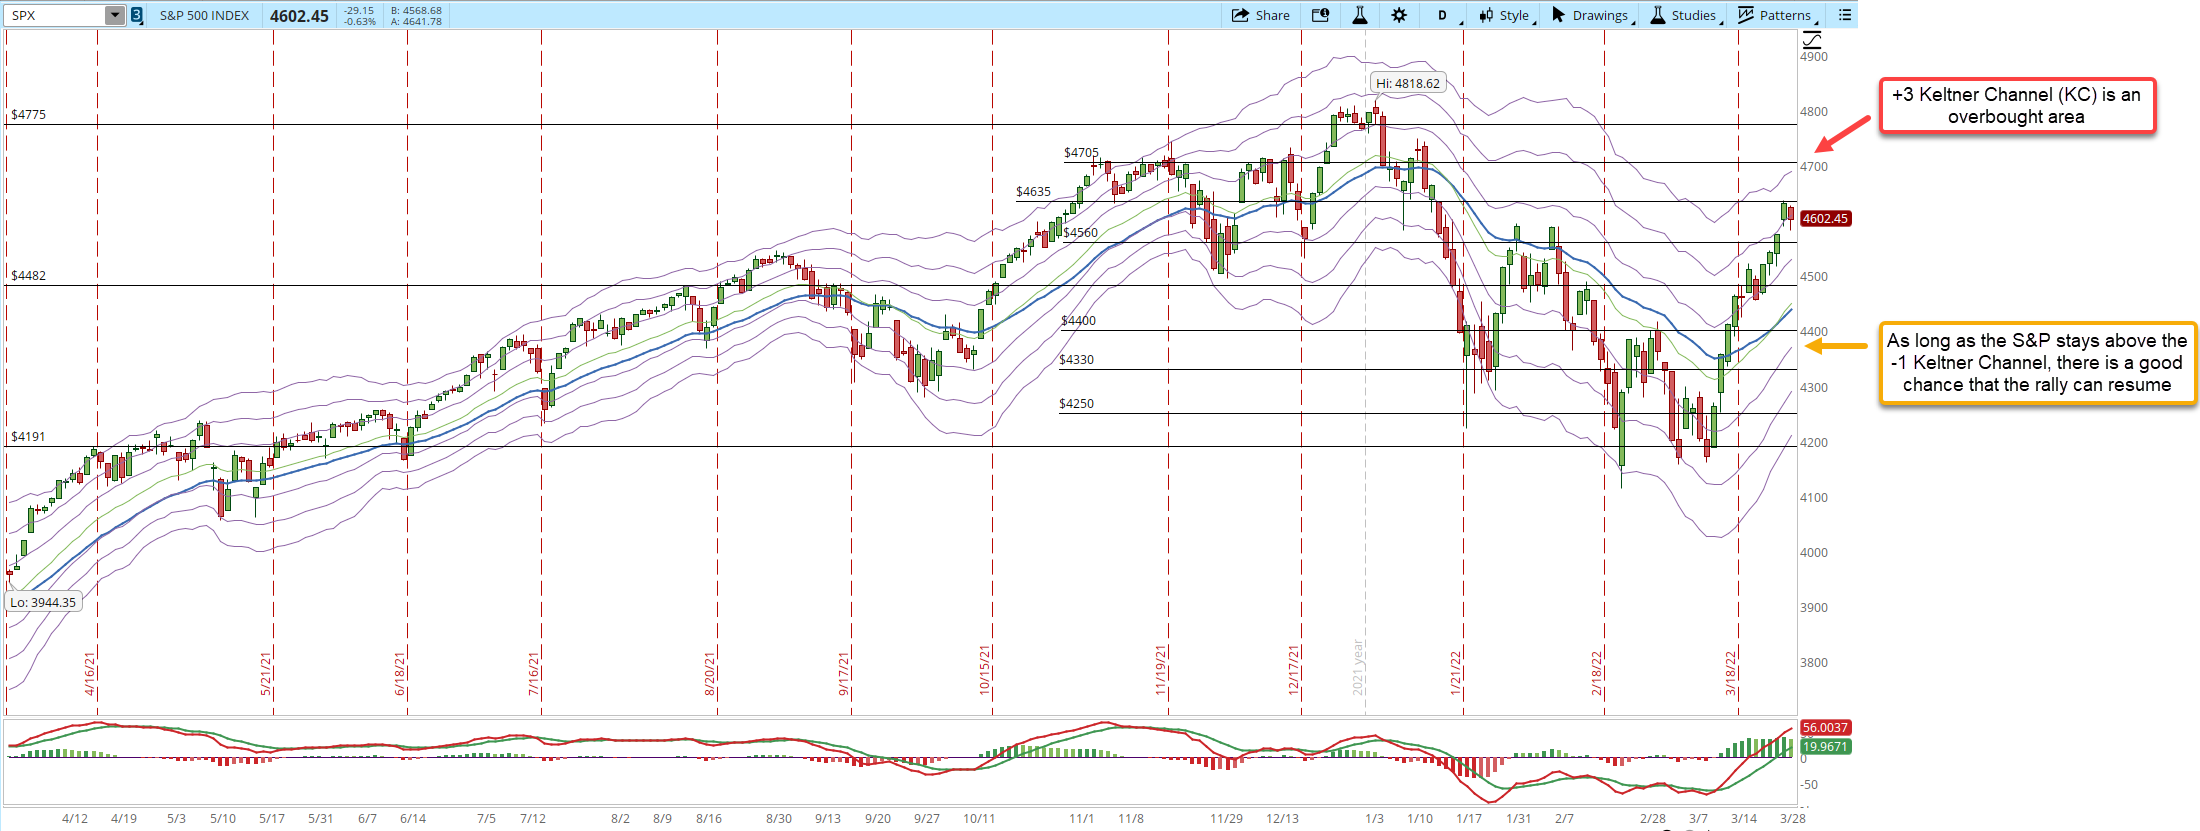
I'll start as usual with the S&P 500 daily chart. The important issue from my point of view, is that we need a pullback in order to get out of the overbought area (+3 KC, red arrow) and that pullback needs to be a healthy one (one that stays above the -1 KC, orange arrow, right now is around 4,365). If the supply can't get absorbed, then the New Monthly Lows can get too elevated and the S&P could close and stays below the -1 KC. All those are red flags that could signal that the rally is over and we need to evaluate how the situation has changed.
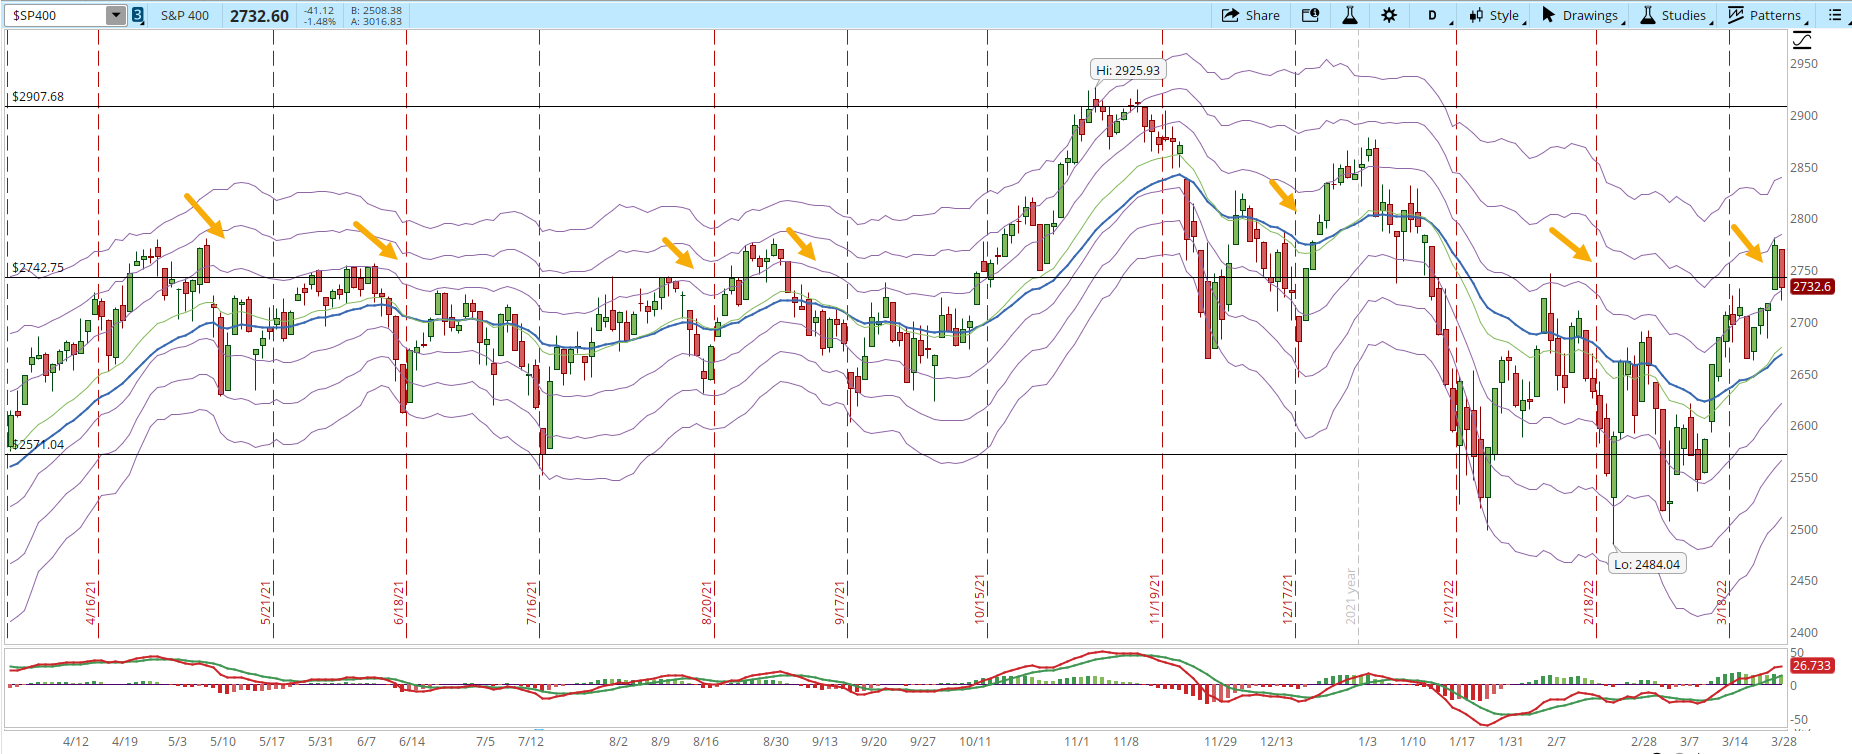
I'm checking on daily basis the mid-cap index of S&P 400, it looks weak, I had pointed out in a previous post how the weekly resistance of 2,742 had caused the index to decline multiple times in the last year (orange arrows). The S&P 400 is already testing the resistance, now let's see if it's able to hold above it, or it will just start declining as in the past.
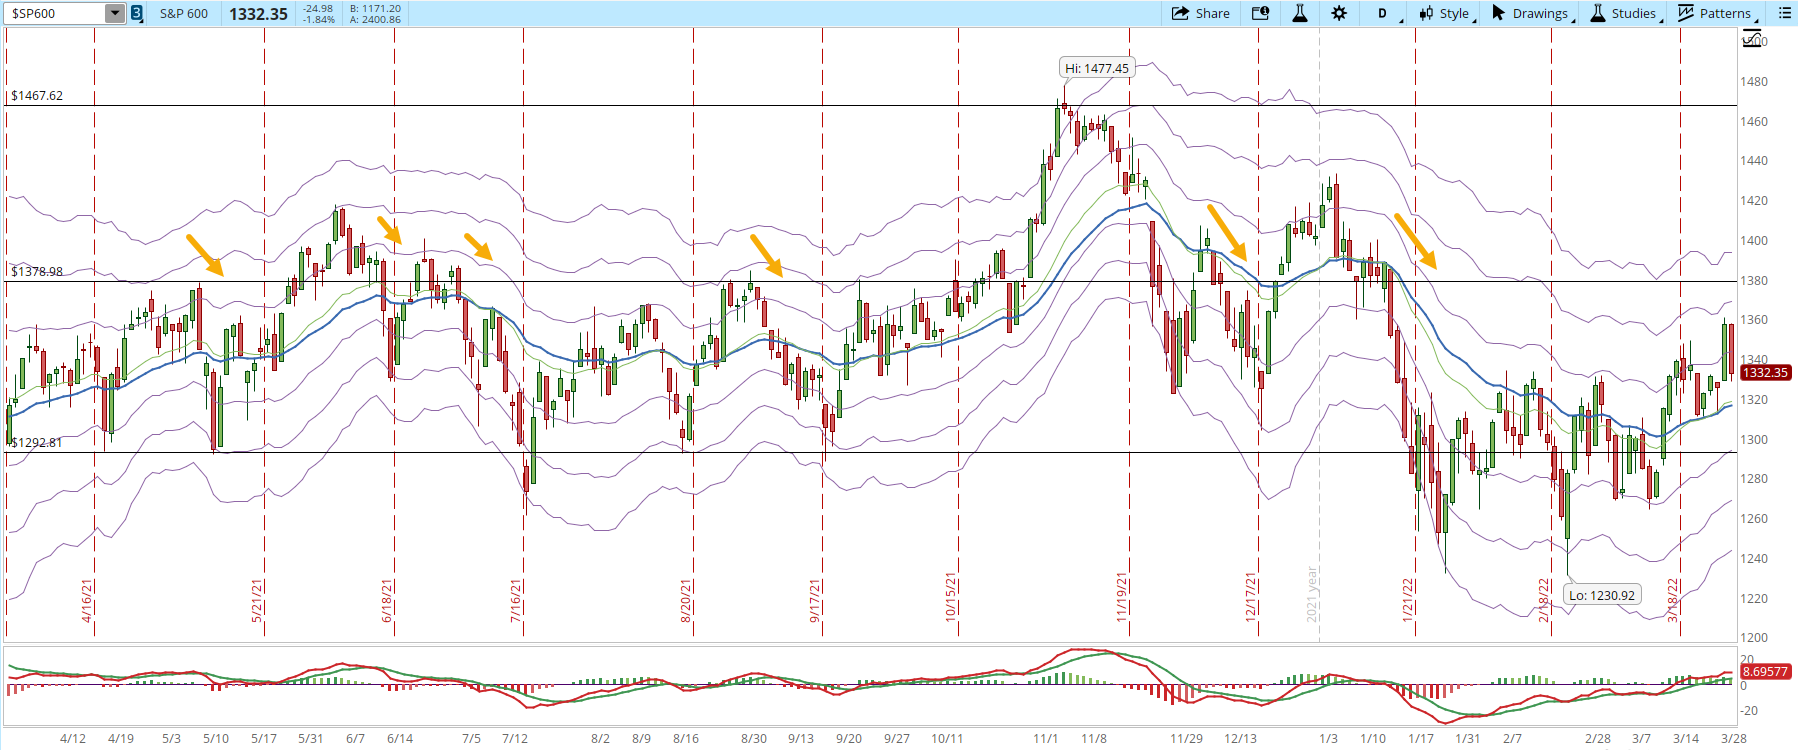
The small-cap index looks even weaker than the S&P 400, the S&P 600 is not even close to reach the weekly resistance at 1,378. Previously that resistance has caused the index to decline in the last year (orange arrows).
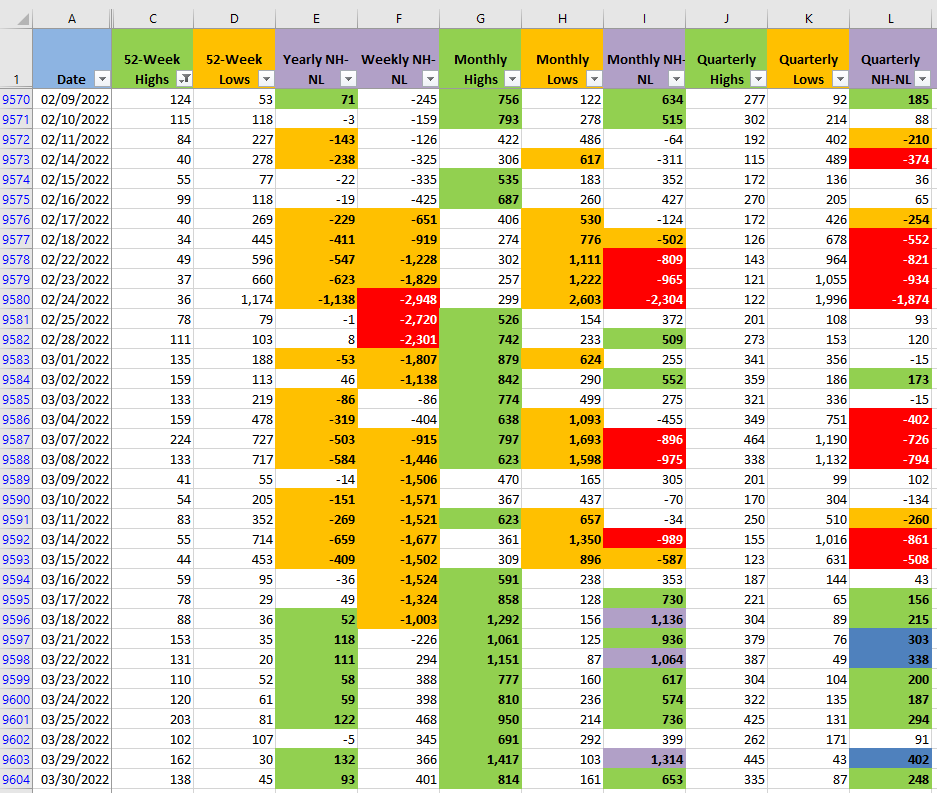
Reviewing the New Highs and New Lows numbers (NH-NL), the Monthly New Highs suffered, fortunately the New Monthly Lows are still at a low level. If we are at the beginning of a pullback, the Monthly columns are the most important ones, since they change a lot faster than the rest, warning of potential troubles ahead.
If a multi-day pullback is indeed beginning to develop, it will be a great way to measure how strong the selling pressure can be. If it can't take the S&P 500 below the -1 KC then there is a good chance that the rally resumes. Otherwise, the selling pressure entering the Market can signal that it's still early to think about aggressive long trading.


