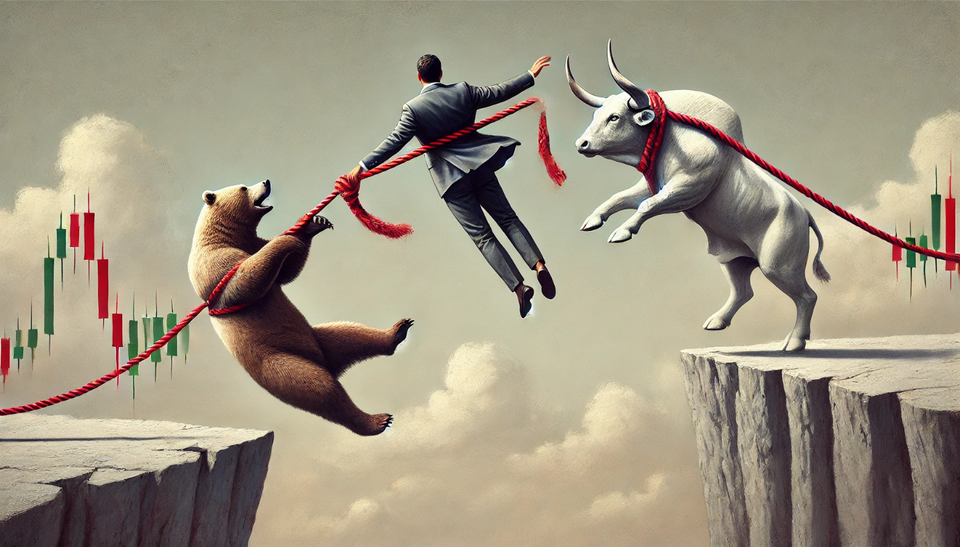
When you start trading, probably the most common advice is "buy low, sell high". The problem starts when you look at the chart and you see the price of a stock, is that low or high? If the price of a company is declining, how do you know that it won't go down any further? The reality is that no one knows for sure.
There are a few pieces of information that can act as clues about what's likely going to happen next.
Keltner Channels
Keltner Channels (KC) are volatility-based bands, depending on how you configure the indicator, they can help you analyze the behavior of the price of an instrument. I like to use three bands above and below the EMA. The first time I heard about this indicator was in Spiketrade.com. They were introduced around 1960, so there's plenty of information about them on the Internet.
+1 and -1 KC: When the price oscillates between the +1 and -1 KC it's just a normal behavior where there is no clear dominance of Bulls or Bears. When the price breaks past the +1 KC, the demand is clearly absorbing the available supply. If the price breaks below the -1 KC the selling pressure is winning the battle.
+3 and -3 KC: When the price makes it to the +3 KC, we are at the overbought zone, people will start wondering if the price still can go any higher and some of them will sell before the price goes down, that usually generates at least a limited pullback in the chart. There are times when the demand is so strong that the price can stay for an extended period at the +3 KC overbought zone, as long as the greed keeps fueling the rally, the price can continue to go up.
The -3 KC is different, it's the oversold zone, when the price goes down that far, there's some amount of fear, even panic in the Market. Fear is a fast sentiment, it moves the price a lot faster than greed and usually tends to last less time.
S&P 500 and the KC: The Keltner Channels have multiple uses, another one is that they can act as references for resistance and support levels. Reviewing the weekly chart of the S&P 500 the +1 KC has been acting as a strong resistance (yellow highlighted areas) and now we are back right at that level (red highlighted area).

The daily chart of the S&P 500 is even less encouraging. Since Jan/2022 every time the index makes it to the +3 KC there has been a sharp decline to the -3 KC (yellow highlighted areas). The price is almost at the +3 KC, someday the pattern will break and the Bulls will be able to rally despite any resistance, it's unlikely that it will be next week.

Another reason for my lack of trust in the current rally is something I pointed out last week. The S&P 500 is composed of the biggest large-cap companies traded in the USA. However, the S&P 400 (mid-cap) and S&P 600 (small-cap) indexes were much more affected by the previous decline than the S&P 500, they are still far away from getting to the +3 KC. The money seems to be flowing towards the less risky assets.

Summary
The S&P 500 is likely to continue its sideways movement between 3,800 and 4,150. My trading plan doesn't work in the current Market environment, so I'm just sitting out and waiting for better opportunities, if I see some attractive setup I might open a pilot trade but that's about it. If the Bulls are able to keep fueling the rally past 4,150 then things could get pretty interesting trading on the long side.
The most likely scenario for the trading week of Apr/03 is a pullback. A healthy decline should stay around 3,920. If the price goes below that level, the fear could send the index back to 3,800. We have experienced this resistance multiple times, let's see if this is the one when finally the resistance is broken or if the index will end again at the oversold zone.


